Calculating the Extreme Forecast Index (EFI)
The Extreme Forecast Index is calculated according to the formula:

where Ff(p) denotes the proportion of EPS (ensemble prediction system) members lying below the p quantile of the climate record. The EFI is computed for many weather parameters, for different forecast ranges and accumulation periods.
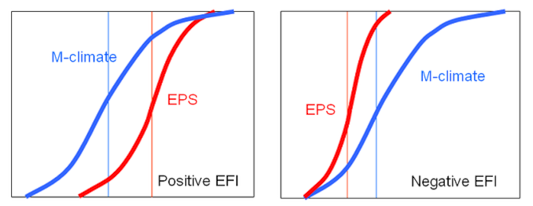
If the forecast probability distribution agrees with the M-climate distribution then EFI = 0. If the probability distribution (mean, spread and asymmetry) does not agree with the climate probability distribution, the EFI takes non-zero values. In the special case where all the members forecast values above the absolute maximum in the M-climate, the EFI = +1; if they all forecast values below the absolute minimum in the M-climate the EFI = -1 (see Figure 1).

Figure 1: The EFI can have both negative and positive values: positive for positive anomalies (upper figures) and negative for negative anomalies (lower figures).
Experience suggests that EFI values of 0.5 - 0.8 (irrespective of sign) can be generally regarded as signifying that “unusual” weather is likely and values above 0.8 as usually signifying that “very unusual” or extreme weather is likely.
The interpretation of the EFI
Although a high EFI value indicates that an extreme event is more likely than usual, the values do not represent probabilities. Any forecasts or warnings must be based on a careful study of probabilistic and deterministic information in addition to the EFI.
Since potentially extreme situations (wind storms, for example) are characterized by high dynamical instability in the atmosphere and large spread, EFI users should be aware that it is not uncommon for an extreme event to be preceded by wide-ranging shallow slope CDFs (cumulative density function), yielding EFI values that are not particularly high. CDFs should be directly referenced. If, for example, the EFI indicates to forecasters that anomalous wind speeds or rainfall rates are more likely than normal, they have to find out from the CDF diagram what this means for a specific threshold, e.g. 5 mm/12 hours. If the climatological risk is 5% and the predicted probability is 20%, the risk is four times larger than normal. Any action will, however, depend on whether this 20% is high enough for a specific end-user to undertake protective action.
Finally, another key issue of the EFI is that members well beyond M-climate extremes contribute no more to the EFI than members matching the M-climate extreme. Recently the Shift of Tails’ has been developed to address this (Tsonevsky and Richardosn 2012).
The EFI reference climate
In EFI the forecast probability distribution is compared to the model climate (M-climate) distribution for the chosen location, time of year and lead time. The underlying assumption is that, if a forecast is anomalous or extreme with respect to the M-climate, the real weather is also likely to be anomalous or extreme compared to the real climate.
The cumulative distribution function
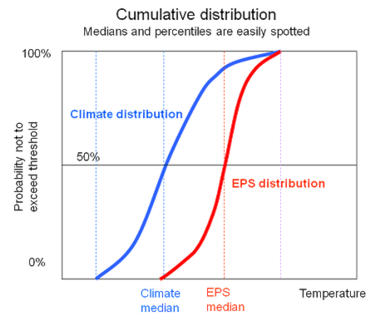
The EFI value is computed from the difference between two cumulative distribution function (CDF) curves: one for the M-Climate, and the other for the current ENS (ensemble forecasting) forecast distribution. The calculations are made so that more weight is given to differences in the tails of the distribution (see Figure 2).

Figure 2: A schematic explanation of the principle behind the Extreme Forecast Index, measured by the area between the cumulative distribution functions (CDFs) of the M-Climate and the ensemble members. The CDF shows the probability (y-axis) against the exceedance threshold value (x-axis). The EFI is, in this case, positive (red line to the right of the blue), indicating higher than normal probabilities of warm anomalies.
From a CDF curve it is also easy to determine the median and any other percentiles as the point on the x-axis where a horizontal line intersects the curve. The most likely values are associated with those where the CDF is steepest.
